How to Optimize YouTube Channel Based on Data
80% of the YouTube beginners may have a question: “How to grow my YouTube channel?”In my opinion, data always gives us the answers. In this article, I will introduce some methods that can help you find out the answers.
Before the answers, please think of a question:” Where to get the data?” Of course, all the data is in YouTube Studio Beta. Now let’s go to the dashboard and check it now.
My channel →YouTube Studio(beta) →Analytics
In the Analytics page, there are five tabs for you: Overview, Reach, Engagement, Audience, and Revenue. Different tab has collected different dimensions of data. In order to optimize a channel based on data, it is helpful to learn more about the five tabs.
1. Overview
The page consists of three modules: Overview dashboard, Top videos, and Realtime activity, you can track the channel performance, Top videos performance and Realtime performance in different time dimensions.

I believe that 70% of beginners may know that, so I am going to introduce you to a powerful function you don’t know: Video Detail Analytics.

Click See More to visit the page, here is the example below:
On this page, you can see that over 10 dimensions of data of your video in this sheet, take note that you can click the blue button to add more dimension of data in your sheet. And then we can explore it as Google sheet or CSV sheet. In my opinion, Average view duration, Unique viewers, Average percentage viewed, Likes, Shares and Comments added are also valuable dimensions. It helps you calculate the more valuable data performance of your videos.
After exploring the datasheet, it is helpful to add filters to find the microdata and winning-video of your channel.
Check the example below:

Calculate the average of data first, and we will use some dimensions of data to compare with the average. Here are 3 dimensions can help you find the problem of videos:
- Average percentage viewed%: If the percentage of a video is lower than average, it tells us that the content is a little bit boring than your average performance because it can not arouse the interest of your audience, you need to shorten your video or add more interesting creation.
- CTR%: Views per impressions shown. This measures how often viewers watched a video after seeing an impression. Besides, it also measures if the thumbnails are attractive enough. Take note that if the CTR is lower than average, it means that you should optimize your thumbnail of the video.
- Impressions:This measures how many times your video thumbnails were shown to viewers. Includes only impressions on YouTube, not on external sites or apps. It’s hard to improve impressions on YouTube.
2. Reach
This tab provides us a new perspective to think about where the traffic comes from, it is also helpful to select the winning traffic channel to put more effort in traffic acquisition.

The photo below can describe how we led to watching time:
The funnel shows us the process of watch time acquisition: Impression→Views→Watch time.
We can find that there is 2 important data index affect us to get watch time: Click-through rate(CTR) and average view duration. So we can think about a question: How can we improve this 2 index?To get higher CTR, we need to design more eye-catching thumbnails and try to add some clickbait keywords in the title. To get a longer view duration, we need to make the videos more creative and add some call to action text in the videos.
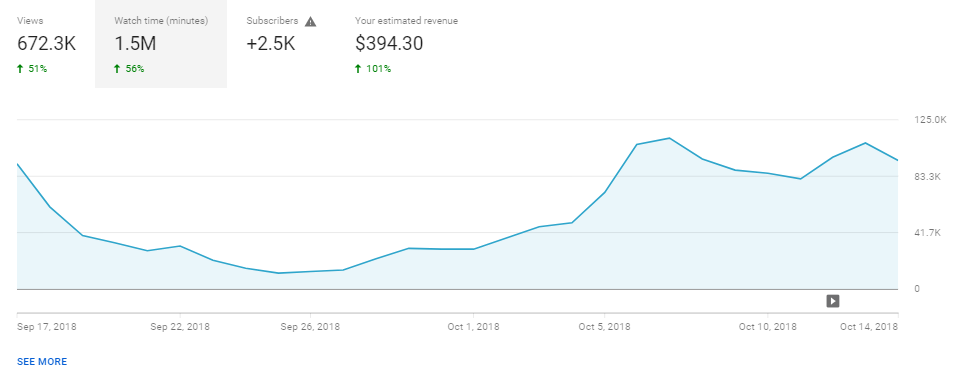
When is the best time for publishing the video?
I believe that many people may be troubled by the question. Actually, the answer is just in your data board. Take a look at the picture below:

In this curve, each of the top points can be used to show the exact date on which day you have the most viewers. After analysis, these vertices have regular dates.
3.Engagement
This tab can help know the engagement rate of top video and setting, you can get information like top video, top videos by end screen, top playlist, top end screen element types, and top cards.
In addition to YouTube Studio, Noxinfluencer can also help us better check the engagement rate of your views, it provides a powerful filter to sort by views, likes, and comment, we can know which video gained more views, which video is liked by your audience, and which videos are topical. Based on these data, we can make attribution to create better content. Click here to check it out.

4. Audience

In this tab, I usually focus on 2 indexes: Average views per viewer and Top countries.

Average views per viewer show the number of views your channel received per viewer in this time period, the higher the number is, the better your contents are.
For top countries, it can help us to discover the countries of the potential audience. The native language will be helpful to gain more audiences from the target countries.
The power of data is very powerful, it requires us to invest more time to analyze and extract. Getting into the habit of data analysis can help us run our channel better, have you learned that?
Rzuc okiem na moj vlog z Chorwacji https://www.youtube.com/watch?v=txzCK4JhbpY
I’m grateful for having you as a friend!
Nice to meet you