2020 Influencer Marketing Report: American Micro-YouTubers Stats Insight
2-1024x576.jpg)
Preface
At the end of 2020, Noxinfluencer, a world-leading YouTube analytics and influencer marketing platform, sets to dig out some valuable data from our database and delivers a stats report as a New Year gift for every user who has supported us all the way and our counterparts. Whoever you are, a cross-border e-commerce seller, a YouTube creator, or a video-game issuer, anyone engaged in influencer market can find useful information from this comprehensive report. With a little patience, you will get a deep insight into American micro-YouTubers’ situation and how their traffic condition is.
Sample feature
Noxinfluencer selects 20,000 American micro-YouTubers as samples from the database of 15 million influencers on YouTube. The micro-YouTubers mentioned here are defined as YouTubers with 50,000 to 100,000 subscribers.
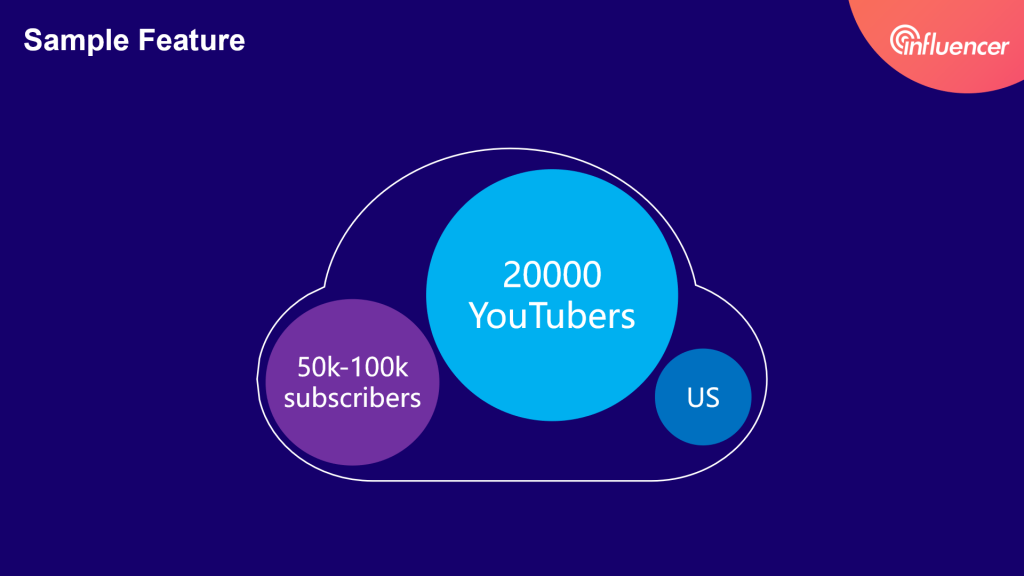
We set the US as the objective country because the US is seen as the main target market by most cross-border businesses by the virtue of the highest ARPU in the US and the highest CPM of American audiences.
Part 1 Channel Portrait
Channel Age and Followings
Let’s see the general profile of these channels with 50k-100k subscribers?
- Channel age means its operation years since establishment. According to Noxinfluencer’s stats, the 20,000 channels have been operated for 6.78 years on average, with an interval from 4 months to 16 years. Simply put, growing to be a micro-YouTuber, a channel with 50k to 100k subscribers, spends at least 6.78 years statistically. During the early 7 years before being a mature channel, YouTubers have to constantly explore unique content style and keep interacting with subscribers with persistence. It is also possible for some talented creators to grow exponentially in 4 months to this scale. To some creators, they enter micro-YouTuber club after 16 years, with great craftsmanship spirit, and persistence.
- Followings: If statistics is not familiar to you, no worry. Let’s make it clear about the mean and median to everyone. Mean, also called average, is the central value of a discrete set of numbers and can be affected by boundary-value. It reveals an average distribution of a population. Median is a value separating the higher half from the lower half of a data sample. Compared with the mean, the median better represents the typical value of a population without being skewed by boundary value which is extremely large or small. It is obvious that the mean and median of 20,000 sample’s subscriber volume is close, 75,058 and 73,200 respectively. We can say the following distribution among the micro-YouTuber group is even.
Channels categorized by content type

According to Noxinfluencer, the top 5 categories in these 20,000 channels are Entertainment, Music, People&Blogs, Gaming, and Howto&Style. Advertiser readers can make some match-ups of your industry with vertical influencers in your influencer marketing efforts, as a way to find targeted audiences. Through this category rank, we can also assess the marketing competition of different industries. For creators who set to on foreign content platforms, these numbers are also valuable for your reference. If views of YouTubers’ content is also a measure you care about most, find it in the next part.
Multi-platform operation
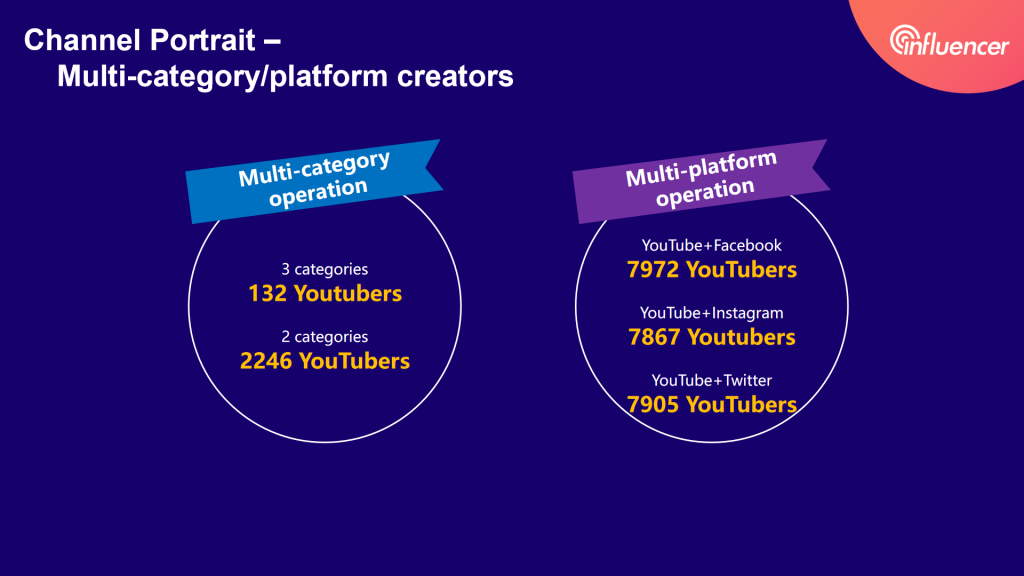
Among micro-YouTubers, many of them are multi-category creators who focus not only on one content category. 2,246 of them create 2 types of content at the same time and 132 YouTubers create in a diversified way under 3 different categories. And multi-platform operating influencers are special ones who have a sensitive appetite for traffic-traction gaining. They usually have accounts on Facebook, Instagram, and Twitter at the same time to public well-made content. They are perfect partners for marketers due to their competence in maximizing marketing impressions through various social media platforms. So, they also provide an opportunity for influencer marketers to do A/B test of promotion campaigns on different channels. Another data that is extremely valuable for marketers: 7,674 influencers, 38.37% of 20,000 samples, have an intention to cooperate with businesses to do brand promotion.
Part2 Insight of channel performance
In this part, Noxinfluencer provides an overview of micro-channels’ viewership. We will see the growth and operation situation of them by analyzing the viewership’s means and medians. Before that, let’s take a few seconds to learn 5 measures of viewership.
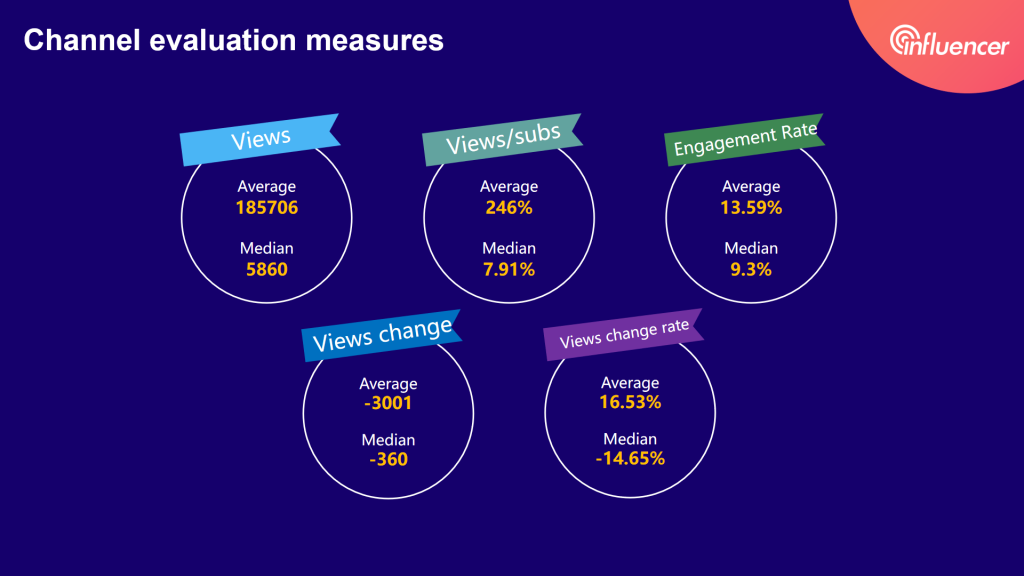
- Views: times to be viewed by subscribers
- Views/subs: rate of average views to subscribers count. This rate reveals how active the channel’s subscribers are and also serves as a measure to assess how attractive the contents are to subscribers.
- Engagement rate: an integrated index calculated through count of likes, dislikes, comments, and average views. A higher engagement rate means a stronger influence the influencer has on followers and more willingness of subscribers to interact with the contents. Amid the pandemic, more time on social media let consumers interact actively with content creators. In this way, influencers can also provide brands with cost-effective and easy-to-produce promotion at a time when large-scale ad production is difficult.
- Views change in different periods: the difference of the average view between the previous 10 and 30 videos. We can see the average views change of recent-released videos from historical ones.
- Views change rate to previous average ones: this is the rate of the fourth measure to last 30 videos average views. Similar to the fourth one, it provides a measure of the change degree.
Mean and median are two of the most important measures in statistical analysis. Such as, the average and middle income of people reflects a country’s economic inequality. In the 2020 influencer Marketing Report, Noxinfluencer does the same analysis over micro-influencers, helping different players and creators to know these channels’ different performance.
Views
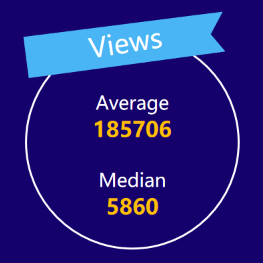
The micro-influencer group has achieved 185,706 views on average and only 5,860 in median, with a difference of 179,846 between mean and median. A large mean-median difference means there is a head effect in the micro-influencer group. Most views are generated from few influencers at top of the pyramid.
Suggestions for Influencer Marketing Stakeholders
Marketers should pay more attention to influencers’ average view as a reference in influencer campaigns.
To creators, they should behave better if their average view is lower than the general median, 5,860.
Views/subs
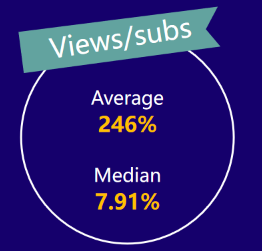
It’s an interesting measure since most influencers cannot make it over 100%. According to Noxinfluencer, 6.91% of American micro-YouTubers (1,382) boast a ratio of views/subs over 100% and the maximum reaches 1,522%, over 15 times. It means at least 1 video of theirs became a viral video, which has the potential to bring them to the next stage beyond the micro-club. According to the median views/subs, most of influencer’s content is able to attract 7.91% of subscribers’ attention. However, don’t overlook the existence of fake followers, subscriber overlaps between different channels.
Engagement rate
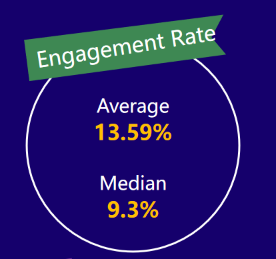
In terms of engagement rate, the mean-median difference registers only 4.29%. This small gap means, in micro-influencer group, their influence on subscribers varies stably. Not ruling out some influencers with an engagement rate over 100%, we can see there are 68 YouTubers, accounting for 0.34%, who reach this level with a maximum of 1161.89%.
Video Views change——last 10 videos vs Last 30
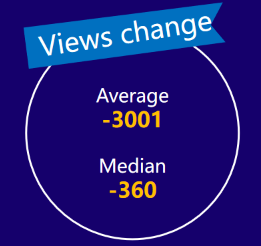
American micro-YouTubers’ views have seen a decrease recently given the negative mean, which means there is a remarkable plummet in extreme value. The largest and smallest change are 770,595 and -1,287,007 respectively. Making a basic deduction, there might be a significant traffic shift to YouTubers with over 100,000 subscribers. Therefore, marketers have to accept the fact that increasing marketing fees of micro-influencers.
Rate of views change
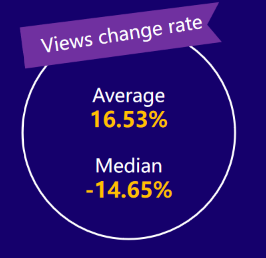
Comparing with the views change, the average growth rate passes a positive signal that around 35% micro-YouTubers are among the fast-growing ones against the situation of general decreasing views. Meanwhile, the mean is 31.18% more than the median. Among all the samples, 307 YouTubers’ views have increased by over 100%. The fastest growth of views reached 3333.43% and the slowest one is -100% (might account for being blocked or cancellation). This set of data indicates a careful selection should be applied amid cooperation with micro-influencers. For creators, no content improvement or optimization will result in decreasing traffic.
Part 3 performance of each category
Same as part 2, where analyzes the whole group’s performance through the means and medians of views, engagement rate, views/subs, views change and its change rate against previous ones, this part will analyze sub-categories’ performance under the same method. And the result will be in descending order in terms of mean-median difference. And we get a performance overview of different categories.
Views
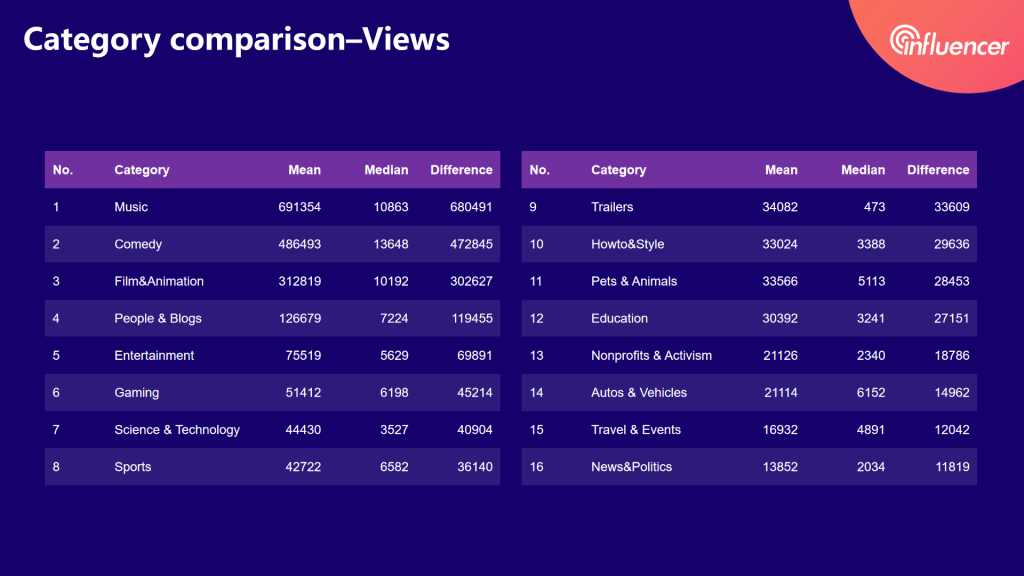
As mentioned in part 2, a large difference between mean and median is a feature of a population that has a head effect. But analysis of views’ absolute quantify should be taken into account. Analyzing from the angle of both marketers and creators, these measures also contains different message.
Suggestions for Influencer Marketing Stakeholders
To marketers, achieving steady impressions from micro-influencers entails more attention to views medians.
To creators, based on the absolute quantity of median views, the average views can tell them the expected traffic gains from different categories and they can decide whether to continue or stop creating that category contents.
Engagement rate
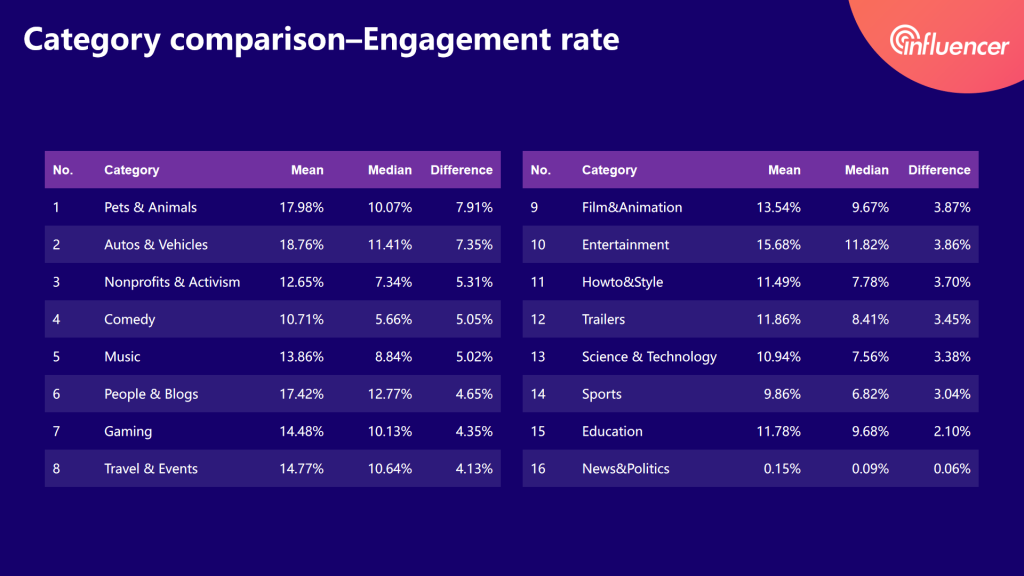
Engagement rate is an essential standard to evaluate an industry’s traffics value. On the Internet, it is love that motivates followers to interact with influencers. And it is also love that makes people nitpick on the contents they are interested in. According to the list above, the average engagement rate is led by Auto&Vehicles, Pets&Animals, People&Blogs, Travel&Events, and Gaming.
Suggestions for Influencer Marketing Stakeholders
To marketers who are in industries related to these top categories above, it is suggested to keep dedicated to it due to enormous interests on the Internet gathered here. Keep exploring better service to provide will make marketers rewarded better by audiences.
To creators under these categories, you have collected the highest-value subscribers who have passion for your content once your engagement rate has overtaken the median number meaning your contents are non-copyable.
Views/subs
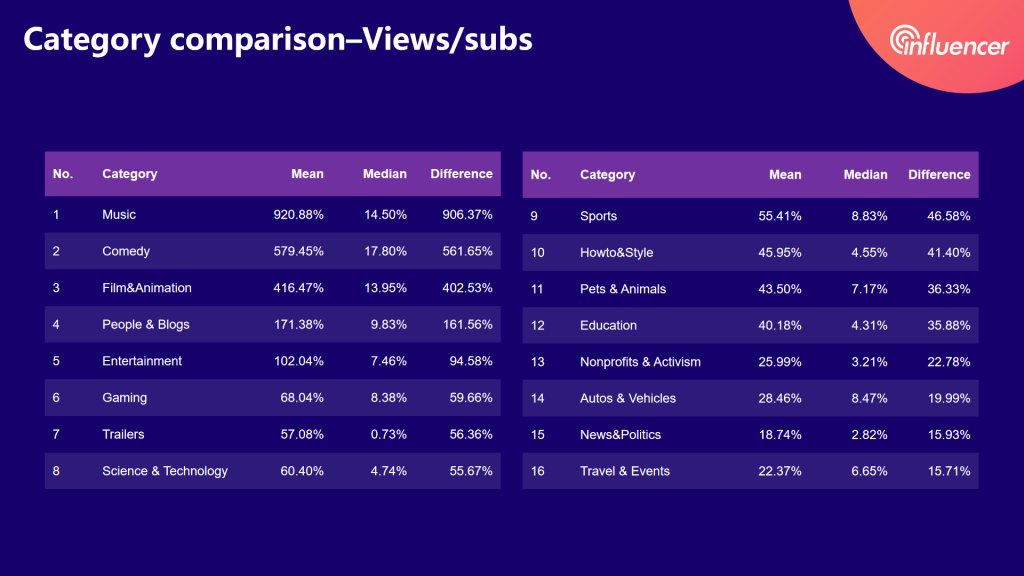
Head effect has been an inescapable reality in the micro-influencers group, which signals fierce competition. 20% of leading influencers are not easily to be surpassed by 80% rest. However, have we ever thought about which category is easier for us to become the front ones? Of course, there are! On this views/subs list, the rate of views to subs of the top 5 categories all exceed 100%. It means contents under these 5 categories are more possible to appear as viral content.
Suggestions for Influencer Marketing Stakeholders
To marketers, an explosive marketing impression might be achieved if you partner with promising influencers selected through data analysis. This kind of explosive traffics brought by one viral content will make a long-term return in the future 1 to 2 years.
To creators who have a craftsmanship spirit, choosing these categories will make you closer to making a viral video, which even likely to bring you to be a KOL.
Video Views change——last 10 videos vs Last 30
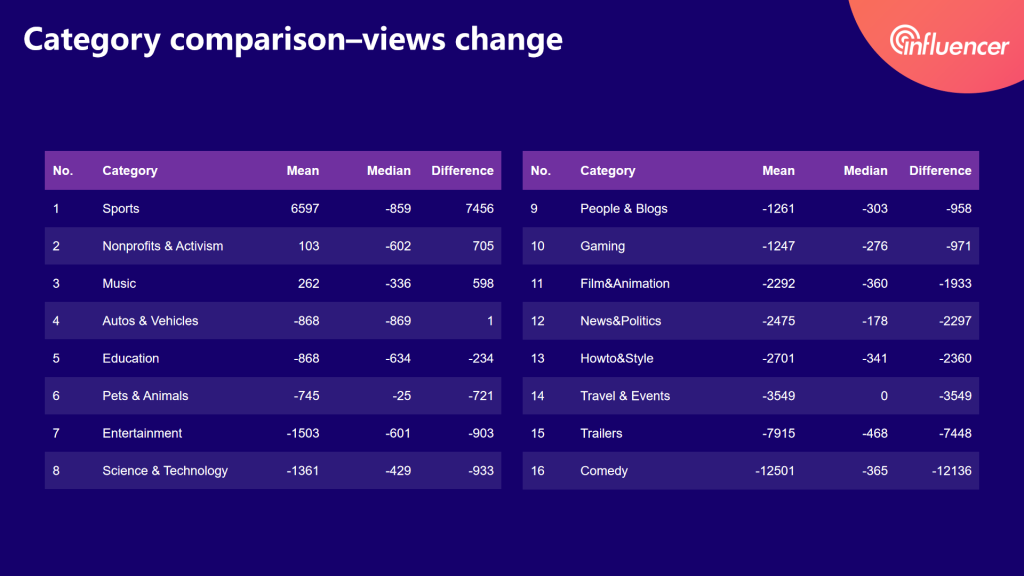
Quoting the inference in part 2, we will mainly discuss the categories which have a smaller difference between their means and median in terms of views changes. Although there is a remarkable view decrease in micro-influencer group generally, under some specific categories, there still exist ones that have the small mean-median difference, which indicates strong influence the YouTubers have and great stickiness with their subscribers. To top 5 ones on this list, Sports, Nonprofits&Activism, Music, Autos&Vehicles and Education will find a way out from plight as time goes on.
Views change rate
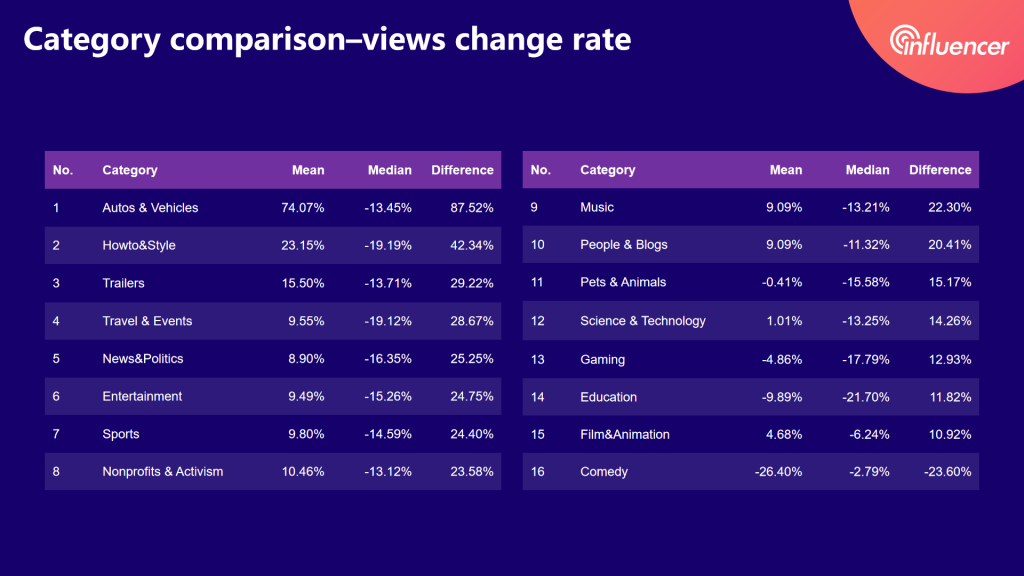
In this last measure, we will still conclude something from these “miserable” numbers. It is worth to notice all categories that have positive views change rate, which indicates these influencers are undergoing a transition to be macro-influencers and their gap with those who still stay in middle are growing.
Suggestions for Influencer Marketing Stakeholders
Meanwhile, to marketers, partnership with potential macro-influencers will be lucrative in the advantage of traffic growth.
To micro-influencers in middle place, facing more pressure from potential macro-influencers, you can only survive by optimizing contents and win the competition.
Conclusion
To sum up, a distinct head effect in micro-YouTubers in terms of views and views/subs reveals that most traffic is held by front micro-YouTubers. Viral contents can proliferate creators’ traffic but are more possible happen to front ones and under specific categories.
Therefore, to get the best marketing impression, marketers should do some research and pick quality influencers to partner in influencer campaigns, coupled with Noxinfluencer’s stats analysis about each YouTubers. Micro content-creators aiming to ride into head ones should choose the right categories to weigh in and create viral content by ever-optimization.
Various conclusions have arrived through channel portrait, performance in statistics, and comparison among measures by Noxinfluencer. Extra insight can also be achieved by readers’ own analysis coupled with other perspectives. Hope this 2020 Influencer Report can offer some help.
Thanks for reading. Until next time.
Hello There. I found your blog using google. This is an extremely
well written article. I’ll makee sure to bookmark it and return to read more of your useful information.
Thankks for the post. I’ll certainly return.
Wow, that’s what I was seeking for, what a data! existing here at this blog, thanks admin of
this web site.
Please keep us up to date like this. Thanks for sharing…
Hi tnere too every body, it’s my first go to ssee of this webpage; this webpage contains amazing and
really excellent data in ssupport of readers.